
Actas del Congreso Nacional de
Tecnología Aplicada a Ciencias
de la Salud

Actas del Congreso Nacional de Tecnología Aplicada a Ciencias de la Salud Vol. 2, 2019
El presente trabajo describe el diseño pruebas y resultados de un sensor ECG portable inalámbrico y de fácil uso, construido para su empleo en investigaciones académicas, así como para su uso público. El sensor se diseñó para trabajar junto a una interfaz gráfica de usuario para proveer visualización en tiempo real y procesamiento digital para obtener los latidos por minuto y determinar si el mesurando está sufriendo de taquicardia bradicardia, o ninguna de estas. El sensor propuesto está basado en un simple amplificador de instrumentación una etapa de filtrado, digitalización y comunicación Bluetooth. Los componentes usados en el dispositivo fueron seleccionados específicamente debido a su bajo consumo de corriente y bajo voltaje de operación con el propósito de que dicho dispositivo sea capaz de operar con una pequeña batería LiPo de una sola celda a 3,7 V.
Palabras clave: EEG, Biosieñales. Inalámbrico, Vestible.
The present paper describes the design, test and results of a wireless portable and easy-to-use ECG sensor intended for academic research as well as general public users. The sensor was designed to work along with a dedicated graphical user interface to provide real time visualization and digital processing to count the beats-per-minute and determine if the studied subject is suffering tachycardia, bradycardia, or none of them. The proposed sensor is based on a simple operational amplifier, a filtering stage, digitization and Bluetooth communication. The components being used on the device were specially selected for its low current consumption and low voltage operation in order for it to be able to run on a small single cell LiPo 3.7V battery.
Keywords: EEG, Biosignals. Wireless, Wereables
The electrocardiogram (ECG) is a method to measure and record different electrical potentials of the heart [1]. The ECG may be divided into different phases of depolarization and repolarization of the muscle fibers. The depolarization phases correspond to the P-wave (atrial depolarization) and QRS-wave (ventricles depolarization). The repolarization phases correspond to the T-wave and U-wave (ventricular repolarization) [2]. A typical ECG signal is shown in Figure 1, where the different phases can be observed.
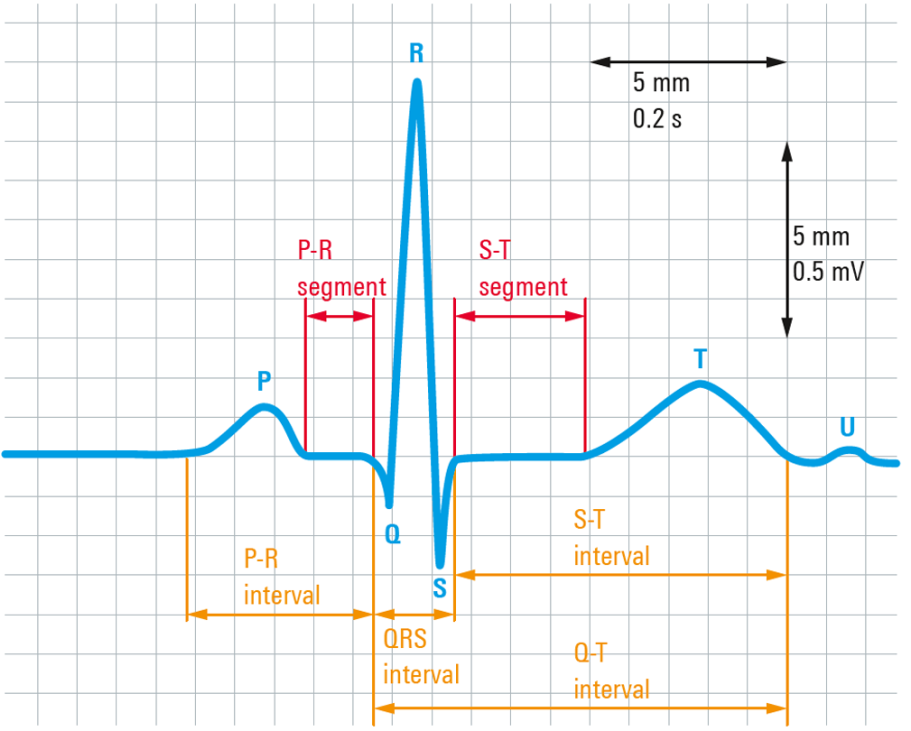
Figure 1. Typical ECG signal with segments and complex label (https://www.rohde-schwarz.com/in/applications/capturing-small-ecg-signals-in-medical-applications-application-card_56279-152385.html#media-gallery)
Recent research has also focused on the development of wireless sensor and pervasive monitoring systems for cardiac patients. For example, a number of wearable systems have been proposed with integrated wireless transmission, GPS (Global Positioning System) sensor, and local processing [3, 4]. Commercial ECG wireless sensors are already available in the market, like the Shimr3 ECG Unit form shimmer, which is a configurable sensor module that can be used in a variety of data capture scenario [5].
2.1 Acquisition stage
It is known that the electrical heart activity might vary from 100uV to 1mV. This has been the first parameter to consider for designing the device. Due to its high signal-to-noise ratio and the amplitude of the signal of interest, it was decided to use the AD623 instrumentation amplifier, which not only provides a high CMRR (Common Mode Rejection Ratio) but also a low current consumption and low voltage solution. Both characteristics are good for wireless compact devices [6]. The gain of the amplifier was set to 100 dB [6]. Even though the AD23 provides a reliable first amplification stage, it is necessary a second amplification stage (with a gain of 10 dB) to rise the signal level into the ADC (Analog-to-Digital Converter) in range for the digitization stage.
Cardiac frequency might vary form 50 BPM to 170 BPM, which is equivalent to a periodic signal between 0.8Hz to 3 Hz, those are the two main frequencies that have to be preserved. Therefore, in order to get rid of the baseline due to movement, and high-frequency artifacts, a filtering stage has been added. Two passive filters have been implemented. The first one corresponds to a high-pass filter of first order, which has been placed right after the instrumentation amplifier with a very low cut off frequency of 0.075 Hz. The second filter corresponds to a low-pass filter of first order, with a cutoff frequency of 15 Hz. A block diagram of the acquisition stage, which has been described above, is shown in Figure 2.
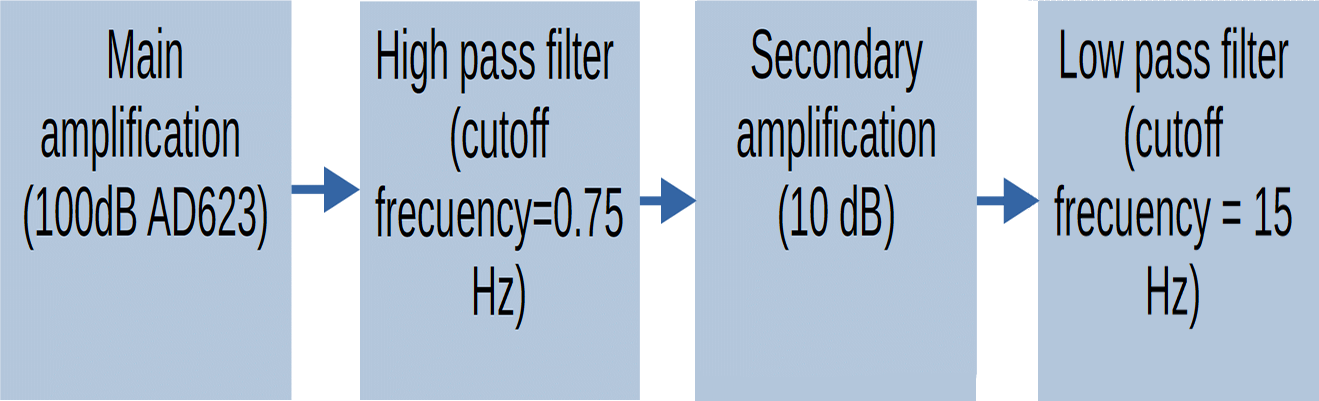
Figure 2. Block diagram of the sensor acquisition stage
2.2 Wireless communication
The next stage corresponds to the digitization of the analog recorded signals. To achieve that, a microcontroller that has an ADC module of 10 bits was used, with a sampling rate of 1 kHz which due to Nuquist Theorem is more than enough for this application to wirelessly communicate with the graphical-user-interface on a computer, a Bluetooth of low energy module (HM-10). This configuration can be appreciated on Figure 3.
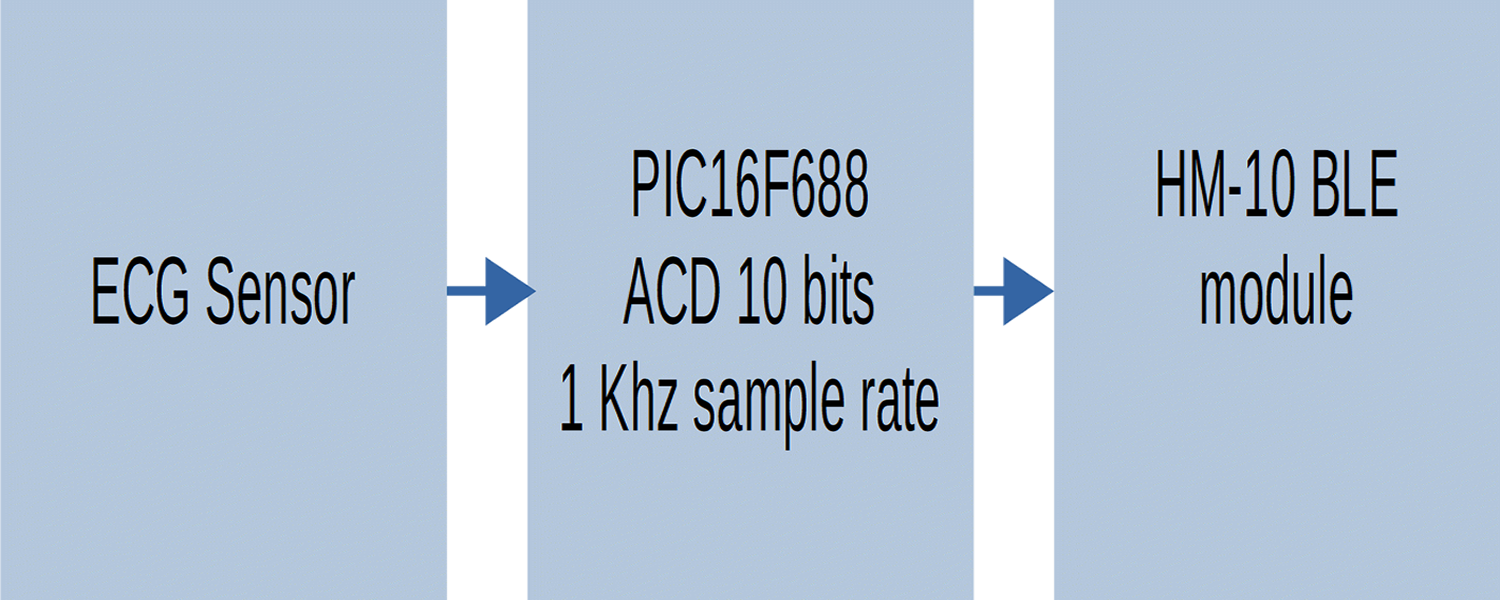
Figure 3 Block diagram of the sensor communication stage
2.3 User interface
A user interface was developed using web application technology such as HTML, CSS, JavaScript and Django. The final graphical interface is shown to the user through a Google Chrome API. The interface was provided with a peak to peak detection algorithm to count the signal BPM and classify it in one of the 3 categories, Bradycardia, Tachycardia, or a normal BPM rate.
The final prototype was developed on two dedicated one-sided circular PCB of 2.5 cm of radius, with the purpose of maintaining a small size, this PCB’s can be appreciated on Figura 4
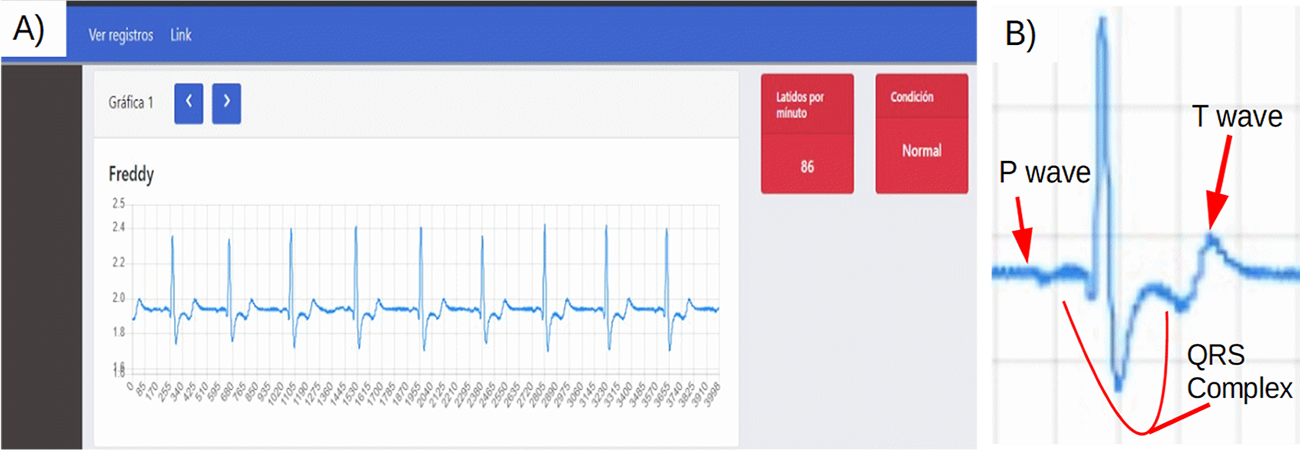
Figure 4: A) Screen shoot of the user interface B) Ampliation of a single ECG cycle with waves and complex labeled
The Sensor and the user interface has been tested with 10 different subjects with 2 different measures on each test subject. The first measure was performed on a rest stage while the second one was performed after putting the subjects to a physical stress, this physical stress consisted on a series of jumping jacks.
The tests described previously were intended to evaluate the graphical representation of the signal, but also to compare the BPM detection algorithm to a reference instrument, specifically a smart watch (apple watch series 3). The BPM detection function showed an efficiency of 95 % on the measures with an error of ± 2 BPM.
A screenshot of the user interface on the performed tests is shown on Fig 5. in can also be appreciate that the sensor is able to detect then main components of the ECG signal, the P and T wave and the QRS complex.
According to the tests, It has been proved that the physical complexion off the test subjects is not reflected on the ECG signal visualization. The BPM detection had an efficiency of 95% however this can be corrected by adjusting the algorithm parameters. The size of the sensor and its filtering stage make it a suitable tool for low intensity physical activities analysis. As future work it is proposed to integrate this sensor among other biosensors in order to obtain a simultaneous test measures creating a complete system.