
Actas del Congreso Nacional de
Tecnología Aplicada a Ciencias
de la Salud

Actas del Congreso Nacional de Tecnología Aplicada a Ciencias de la Salud Vol. 2, 2019
El fonocardiógrafo es un dispositivo generalmente utilizado para la detección de patologías cardíacas y respiratorias. El objetivo principal de este trabajo es presentar un sensor fonocardiógrafo, que podría utilizarse en el campo académico y en el hogar. La señal medida se conecta a través de bluetooth a una computadora para ser procesada en una interfaz gráfica de usuario, en la que se pueden obtener los latidos por minuto (bpm), y se pueden detectar arritmias, como taquicardia o bradicardia, en tiempo real. La principal ventaja del sensor propuesto es su bajo costo y portabilidad. El sensor ha sido probado en 8 sujetos sanos, antes y después de realizar actividad física. Según los resultados, hay una eficiencia del 61,5%. Actualmente, el algoritmo de detección está siendo mejorado para aumentar la eficiencia.
Palabras clave: Fonocardiógrafo, Diagnóstico preliminar, Comunicación inalámbrica
The phonocardiograph is a device generally used for the detection of cardiac and respiratory pathologies. The main objective of this work is to present a phonocardiograph sensor, which could be used in the academic field and at home. The measured signal is connected via Bluetooth to a computer to be processed in a graphical user interface, in which the beats per minute (bpm) can be obtained, and arrhythmias, such as tachycardia or bradycardia can be detected, in real time. The main advantage of the proposed sensor is its low-cost and portability. The proposed sensor has been tested to 8 healthy subjects, before and after physical activity. According to the results, there is an efficiency of 61.5%. Currently, the detection algorithm is being improved to increase the efficiency.
Keywords: Phonocardiograph, Preliminary Diagnostic, Wireless communication
Heart sounds are probably the most familiar body sounds which auscultation was fundamentally improved by the invention of the stethoscope. In general, these sounds are related to the contractile activity of the cardiac system, including the heart and blood together, and the blood’s turbulence in atria and ventricles of the heart. The sounds yield direct information on myocardial contractility and the valve’s closure in the heart. The first heart sound (S1), associated with the closure of atrioventricular valves, has a duration of about 140ms with the spectral peak at about 30Hz. The second heart sound (S2), associated with the closure of semilunar valves, shows shorter duration of about 110ms, lower intensity, higher frequency components, and a more snapping quality than the first heart sound. In Fig. 1 these sounds are shown compared with an electrocardiogram. Early studies found that the spectral components are negligible above 110Hz in normal heart sounds or reside in the approximate range of 20–120Hz [1]. The term bradycardia refers to a low heart rate (less than 50 bpm), while tachycardia corresponds to an increment in the heart rate (greater than 100 bpm) [2].
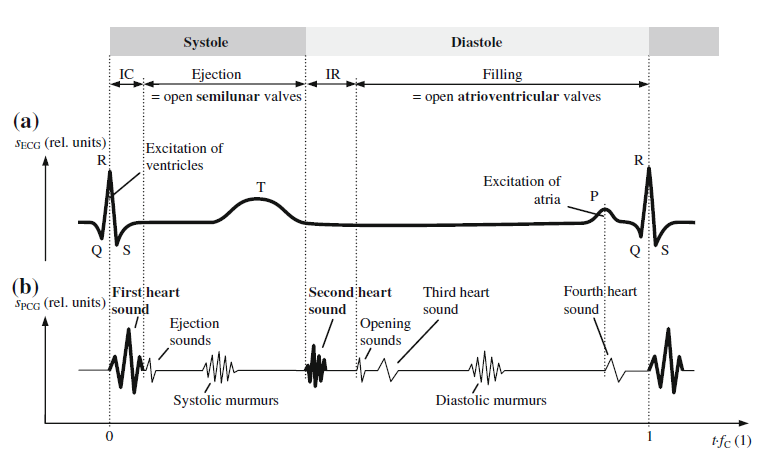
Figure 1. Schematic waveforms of (a) electric biosignal electrocardiogram sECG with typical waves and peaks in relation to (b) acoustic biosignal phonocardiogram sPCG during the cardiac cycle with the duration 1/fC where fC is the heart rate. Image taken from [1]
There are devices capable of sensing cardiac sounds designed for diagnostic purposes, such as the 3M Littman Stethoscope with Bluetooth, model 3200BK27 [3] which has the function of capturing the acoustic signal and the conversion to a digital one. However, there are others that, in addition to diagnostic purposes, are educational such as Ekuore [4], which has an interface that can be used on a tablet, cell phone and computer. Previously, analysis of signals from stethoscope with diagnostic capability has been proposed as in [5].
The main objective of this work is to present a phonocardiograph sensor, which could be used in the academic field and as general use at home, since it has a user-friendly interface in which the beats per minute can be obtained, and arrhythmias, such as tachycardia or bradychardia can be detected, in real time.
2.1 Electronic design of the phonocardiograph
The design of the proposed phonocardiograph has different stages. A block diagram of the design is shown in Figure. 2.
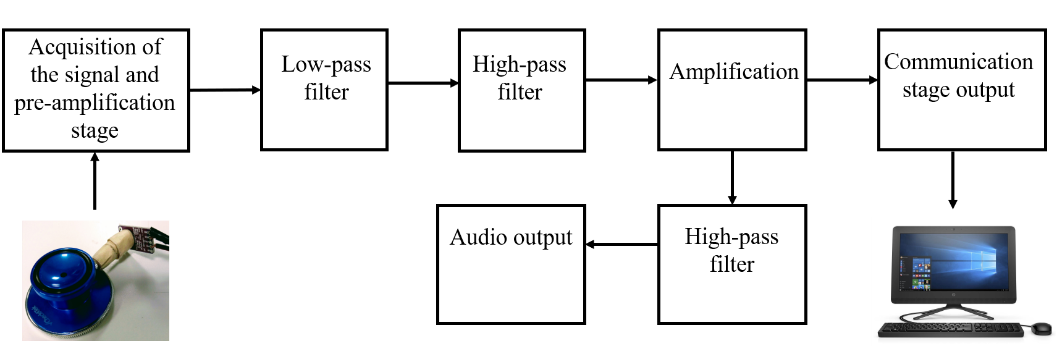
Figure 2. Block diagram of the design
As a first stage, the measurement of cardiac sounds has to be performed. The acquisition of the acoustic signal was made with the module electret microphone amplifier MAX9814 with auto gain control, which was set to a gain of 60 dB, and an offset of 1.25 V. For the acquisition of the signal, the microphone module was connected to the bell of a commercial stethoscope (CheckAtek) as shown in Fig. 3.
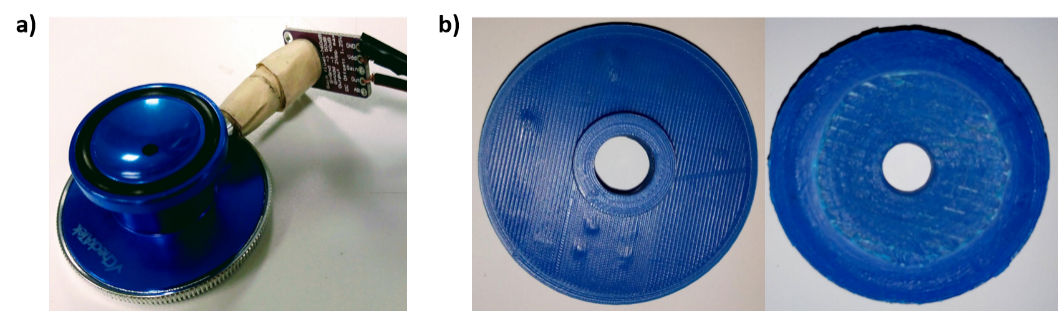
Figure 3. Electret microphone module attached to the commercial stethoscope bell
Considering the range of frequencies in which normal and abnormal heart sounds are found, a second-order Butterworth low-pass active filter with a cut-off frequency of 137 Hz was designed. Then, in order to suppress the DC voltage, i.e. the offset, a first order high-pass passive filter is implemented with a cutoff frequency of 0.16 Hz. Once the offset was removed, then an amplification is carried out with a gain of 10. To digitize the signal, it was necessary to have an offset again since only positive voltages are handled. Therefore, the offset (1.25 V) already created in the microphone module is used. However, to listen the heart sounds by means of earphones, it was necessary to remove the offset. To achieve that, a first order high-pass passive filter was used at a cutoff frequency of 0.16Hz. The circuit was powered with 3.3 V and implemented on a copper plate.
2.2 Communication and interface
To achieve the analog-to-digital conversion and the communication with the computer, a microcontroller (PIC16F688) that has an ADC module of 10 bits was used. The sampling frequency employed is 1 kHz. Moreover, a Bluetooth of low energy module (BLE, HM-10) is used to wirelessly communicate with a computer and visualize the registered signals in the graphical user interface.
As part of this project a web application was developed using frontend technologies like HTML, CSS and JavaScript and Django as the main framework for the backend including the database management. To establish wireless communication between the sensor and the application, a BLE module was attached to the communication board and the Chrome API for BLE was used in the application. The Chrome Bluetooth API enables the wireless communication only when the user accept it. For this reason, it is known as event driven, which means the user must click on a button to start the search for near available devices and then select the device to connect to. Once the communication is established, the user can start the acquisition of the signal by clicking a button. After this, the incoming signal is plotted and some information of the signal is visualized in real-time. By clicking the stop button, the acquisition is finished and the user can save the acquired signal to the database for further processing.
The application has a landing page where the user can find links to login to an existing account by entering its username and password. Moreover, the user can also sign in to create an account and use the application features. Once the login process is completed, a dashboard which contains a list with the instances of every saved signal by the user is displayed. This list contains information related to the kind of biosignal, length of samples, date of acquisition and subject name from which the biosignal was taken. The board contains a button that displays a form to create a new instance of a signal introducing the kind of signal and name of the subject. The user can edit the information of the signal, remove it and a link to a view where the acquisition process take place once the communication between the sensor and the application running in the browser is started.
2.3 Tests with the prototype
To test the performance of the proposed phonocardiograph sensor, the signals of 8 healthy subjects were measured before and after physical activity such as run for five minutes at medium intensity and go up-stairs or do an anaerobic activity. For each subject, the bpm were measured with both, the proposed sensor and with a commercial device (Mi Band 2, Xiaomi). All of the subjects have signed an informed consent letter in order to use their data for research purposes only. The results are shown in the next section.
It was possible to establish wireless communication with the computer for the visualization and analysis of the signal in real time. Moreover, it was possible to listen through the audio output with a headset. Using the sensor and interface described above, in Fig. 4 it is shown an obtained signal from a subject in a resting state (Subject 1). Their bpm and their condition are observed. In this case, the results show a normal condition. In Fig. 5 the resulting signal (from the same subject) after physical activity is observed. The detected condition was tachycardia since the heart rate exceeded the established threshold (100 bpm). It is possible to distinguish sounds S1 and S2 in both signals.
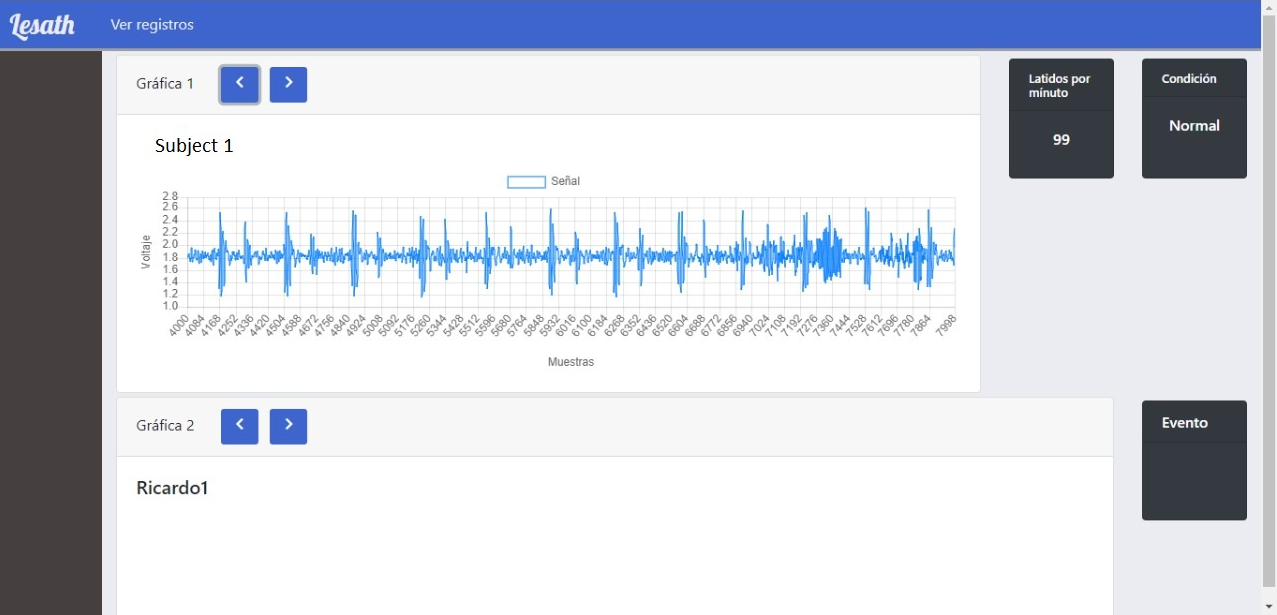
Figure 4. Image of the interface from a measurement of Subject 1 at rest
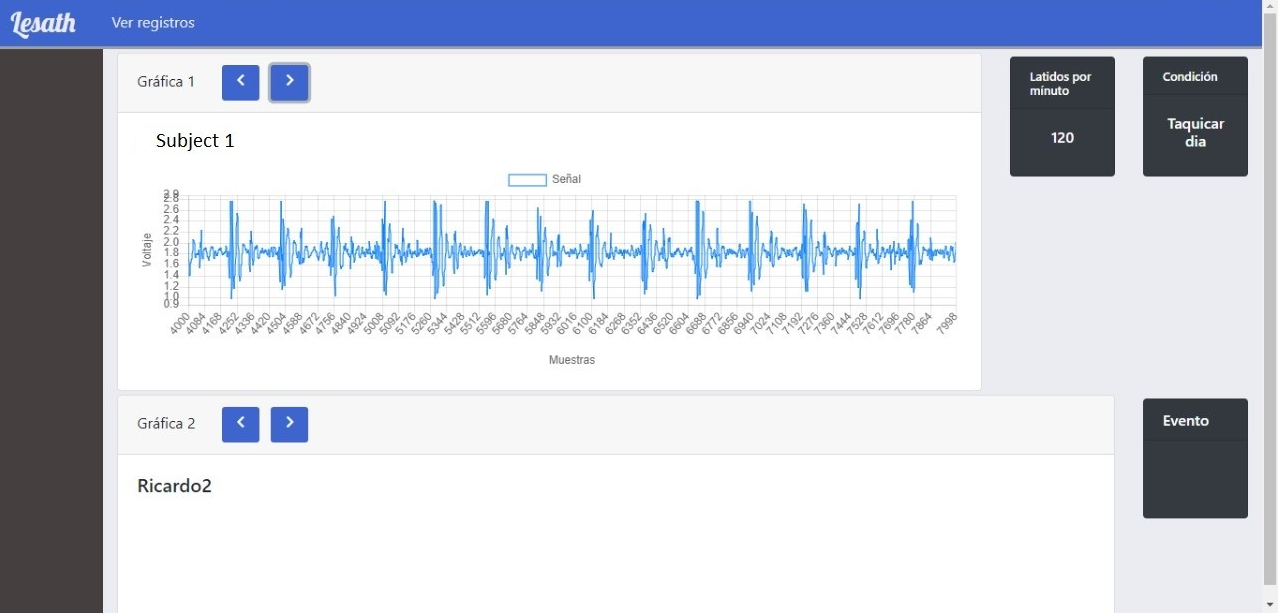
Figure 5. Image of the interface from a measurement of Subject 1 after physical activity
A ±3 bpm error range was established in each measurement in order to compare the proposed sensor results with the commercial one. According to this, the number of measurements that were equal or differed at most by ±3 bpm between the prototype and the control device was obtained. Based on the results, the efficiency using the 16 data (2 for each subject corresponding to rest and physical activity) was 61.5%.
A prototype of a phonocardiograph with wireless communication and a graphical user interface with signal registration and arrhythmia detection capability (bradycardia and tachycardia) was developed. Its functionality was verified at rest and after physical activity. As a preliminary result, an efficiency of 61.5% was obtained. However, the detection algorithm is being improved to increase this value. This also raises the possibility of including a murmur detection algorithm. As a future work, it is pretended to integrate the proposed sensor to a set of devices for the simultaneous measurement of different physiological variables in real time. Moreover, it is possible to design and implement a 3D-printed bell in order to reduce the cost and to have a better quality of the acoustic signals.