
Actas del Congreso Nacional de
Tecnología Aplicada a Ciencias
de la Salud

Actas del Congreso Nacional de Tecnología Aplicada a Ciencias de la Salud Vol. 4, 2022
We present a proposal based on medical image processing using the Fourier transform devoted to analyzing brain tissue in studies performed with electromagnetic tomography. We analyze transversal and longitudinal cuts (medical imaging) in 3D tomographic studies of brain tissue. We focus on the biochemical response of the brain to the tomographer’s electromagnetic radiation to focus on the non-uniform illuminated zones in the image. We compare such zones in both the transversal and longitudinal cuts to select our Region of Interest (ROI) in the brain tissue to determine an anomaly. We apply the Fourier transform to contrast the original image, and we validate in the error estimation from such comparison whether it indicates the presence of an anomaly.
Keywords: Anomaly, tomography, Fourier transform
Presentamos una propuesta basada en el procesamiento de imágenes médicas mediante la transformada de Fourier dedicada al análisis del tejido cerebral en estudios realizados con tomografía electromagnética. Analizamos cortes transversales y longitudinales (imagen médica) en estudios tomográficos 3D de tejido cerebral. Nos centramos en la respuesta bioquímica del cerebro a la radiación electromagnética del tomógrafo para centrarnos en las zonas iluminadas no uniformes de la imagen. Comparamos dichas zonas en los cortes transversal y longitudinal para seleccionar nuestra Región de interés (ROI) en el tejido cerebral donde determinaremos si existe alguna anomalía. Aplicamos la transformada de Fourier para contrastar la imagen original, y validamos en la estimación del error de dicha comparación si indica la presence de una anomalía o no.
Palabras Claves: Anomalía, Tomografía, Transformada de Fourier
Mathematical modeling is a tool that allows us to translate a specific problem in nature to formal language based on logical reasoning applicable to solve the problem analytically or numerically according to the science required by the result. The virtues of modeling enable us to have a proper definition and approach to the problem [1], with conditions and variables that can be interpreted in several scientific contexts [2]. Mathematical modeling techniques are based on data simplification and the description of the system behavior to provide an answer or solution to a certain problem in an application field from known data and with the possibility to be estimated without violating or contradicting a known natural phenomenon (laws, theorems, axioms, etc.) [1]. Modeling is per se a crucial tool in scientific research, for example, in satellites’ launching for meteorologic purposes and in damage reduction in natural catastrophes such as hurricanes, earthquakes, etc. [3]. Moreover, mathematical modeling is widely used in medical sciences in complex problems of diverse nature, with special impetus nowadays in diagnostic methods [4, 5] and the identification of anomalies in the human body.
The anomalies identification problem in the human body can be reduced to the analysis of compiled data through other technologies. The problem to tackle is data processing, removing the noise, and reaching conclusions with medical relevance from the analyzed information. These problems are addressed using image processing methods. The Fourier transform method in the fringes pattern analysis originates from the knowledge of the image capture process, with the resulting images representing the physical properties. In this work, we use black-and-white images captured from magnetic resonance in the brain. The information is an energy map of protons inside the body tissue, representing the differences in the tissue types. As such, the fringes pattern analysis using the Fourier transform is helpful in phase variation detection [6], and, along with the image’s information treated as data, we can analyze the tissue differences not observable at first sight.
The anomalies identification problem has a monumental character, with many applications and implications, such as the work by Sarvas [7] and Morín et al. [8]. We observe other modeling applications in the work by Arriaga et al. [9, 10], where we use mathematical tools such as topology and algebraic principles to establish the relationship between variables and the deformation of independent elements in a sample under analysis to obtain the desired results. Differential equations are an element widely used in modeling as well as integrodifferential and integral equations. As an example of the latter, we recall the integral transforms highlighting the Laplace, sine, cosine, and Fourier transforms.
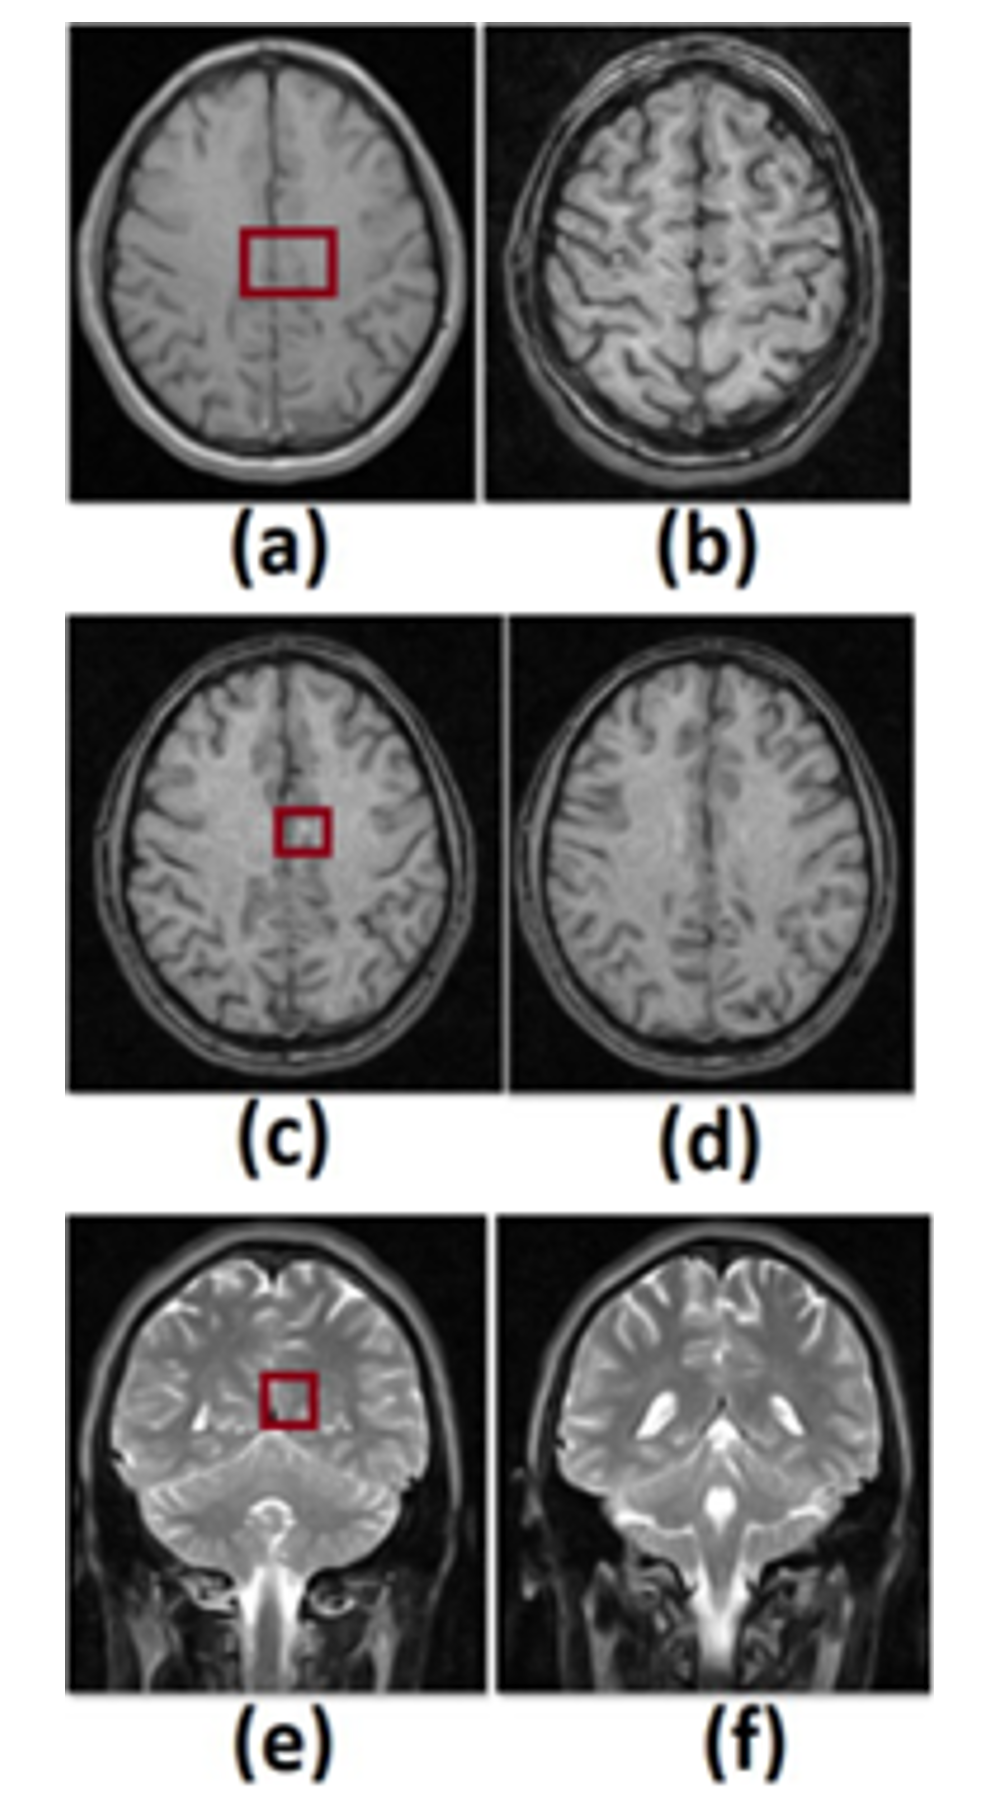
Figure 1. We show a compilation of 6 transversal (a)-(d) and longitudinal (e)-(f) cuts in the brain in a tomographic image, highlighting the ROI in a red square.
We based this work on the Fourier transform to analyze tomographic images in the brain tissue to determine a model that allows us to resolve anomalies in the brain. In Fig. 1, we show the tomographic images of a study carried out in the head of a patient that volunteered for this study, and in Figs. 1 (a)-(d), we show transversal cuts whereas, in (e)-(f), longitudinal cuts in the brain to observe a spot in a lighter tone close to the right hemisphere's center (transversally and longitudinally). In the right square, we highlight the mentioned zone we set as our ROI (Region of Interest).
Our proposal is based on the bioelectrical activity of the brain tissue [7, 8] and its interaction with the tomographer's electromagnetic radiation [4, 7, 8, 11]. As a following step, considering the periodic noise in the medical images in Fig. 1, we can build a simple model where such a noise can be easily illuminated. Recalling that the Fourier transform is an integral transform of the form  , we have Eq. 1:
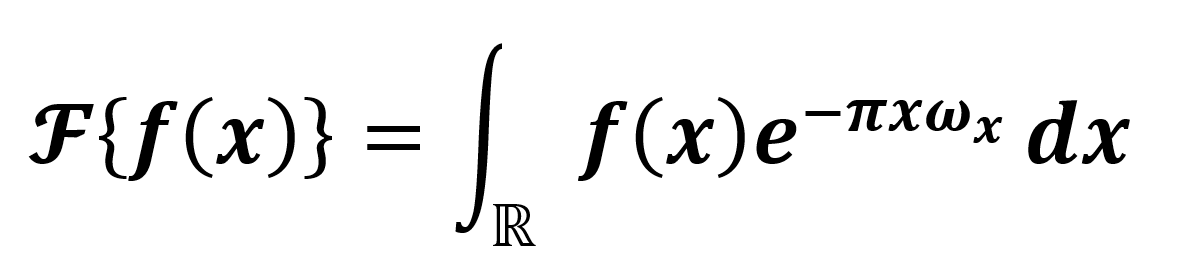
where  is an integrable function, and ω represents the frequencies. Hence, we design an ideal passband filter in the transform space (frequencies space), modeling a mechanism to remove the periodic noise [12]. Finally, we consider that, in a healthy person case, with an ideal metabolism, removing the periodic noise in the medical image from a clinical study of 3D tomography performed by a Fourier transform filtering, the difference between the filtered image and the original one (metadata) should be an extremely low-value noise or close to zero. However, to filter the image, we need to previously build a numerical filter O in the frequencies space ωA. Generally speaking, medical images are 2D and studied as matrices of the form m×m. Thus, Eq. 1 should be modified for the
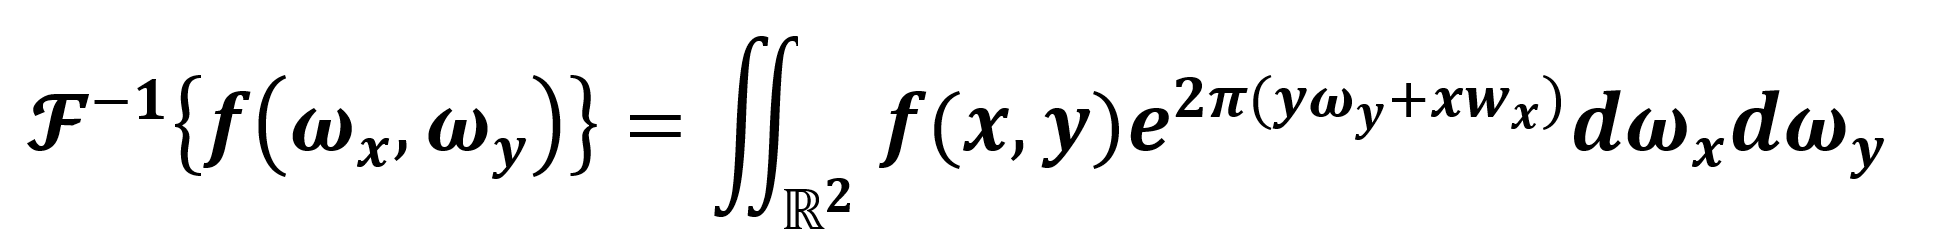
 ![]() case as follows in Eq. 2:
case as follows in Eq. 2:

we consider the space with elements (x,y) and associated with the frequencies (ωx,ωy). From the latter, we can build a filter 0(ωx,ωy) to filter the periodic noise in the original medical image in ![]() {Imfil} =
{Imfil} = ![]() {Im} * 0(ωx, ωy), with the filter 0 centered in the image maximum Im (metadata of the tomographic image in the brain corresponding only to our ROI). Hence, to obtain the observable filtered information (in
{Im} * 0(ωx, ωy), with the filter 0 centered in the image maximum Im (metadata of the tomographic image in the brain corresponding only to our ROI). Hence, to obtain the observable filtered information (in ![]() ), we apply the inverse transform defined by Eq. 3:
), we apply the inverse transform defined by Eq. 3:
we recall that ![]() -1{
-1{![]() { f (x,y ) } } = f ( x,y ) holds for Eq. 3. Hence, to study the existence of a possible anomaly in our ROI, we apply the inverse transform to obtain (ideally) an Im without periodic noise, and we subtract the Im metadata. We consider such a difference as a condition, with a value close to zero implying the ROI is healthy and larger otherwise. Thus, as we describe in Eq. 4, an anomaly is present.
{ f (x,y ) } } = f ( x,y ) holds for Eq. 3. Hence, to study the existence of a possible anomaly in our ROI, we apply the inverse transform to obtain (ideally) an Im without periodic noise, and we subtract the Im metadata. We consider such a difference as a condition, with a value close to zero implying the ROI is healthy and larger otherwise. Thus, as we describe in Eq. 4, an anomaly is present.

In Fig. 2, we show the Fourier transform of our ROI (![]() { Im }), the filter 0 ( ωx,ωy ) centered in the maximum of
{ Im }), the filter 0 ( ωx,ωy ) centered in the maximum of ![]() { Im } (in this case in the center), and we also show the filtered image Imfil =
{ Im } (in this case in the center), and we also show the filtered image Imfil = ![]() -1{
-1{![]() { Imfil } }. Finally, we show our results of the difference between Im (metadata) and Imfil according to Eq. 4 setting Diff =
{ Imfil } }. Finally, we show our results of the difference between Im (metadata) and Imfil according to Eq. 4 setting Diff = ![]() -1{
-1{![]() { Im } * 0( ωx,ωy ) } - Im. To increase the confidence interval in our results, we build a binary mask (Mask) containing only the bright zone inside the ROI (zone with the highest interaction with the tomographer’s radiation [4, 7, 8, 9, 11]) since in this zone lies the anomaly. The ROI can be such a zone alone. However, we do not determine it in this manner due to the segmentation procedure used, given that the ROI in a simple segmentation by regions with simple geometry [4, 8, 9] and carrying out a more complex segmentation would require more powerful IA and computer vision techniques, beyond the scope of our research at this point. Hence, we delimit only the bright zone by building Mask using segmentation functions in an image processing Toolbox in MATLAB®.
{ Im } * 0( ωx,ωy ) } - Im. To increase the confidence interval in our results, we build a binary mask (Mask) containing only the bright zone inside the ROI (zone with the highest interaction with the tomographer’s radiation [4, 7, 8, 9, 11]) since in this zone lies the anomaly. The ROI can be such a zone alone. However, we do not determine it in this manner due to the segmentation procedure used, given that the ROI in a simple segmentation by regions with simple geometry [4, 8, 9] and carrying out a more complex segmentation would require more powerful IA and computer vision techniques, beyond the scope of our research at this point. Hence, we delimit only the bright zone by building Mask using segmentation functions in an image processing Toolbox in MATLAB®.
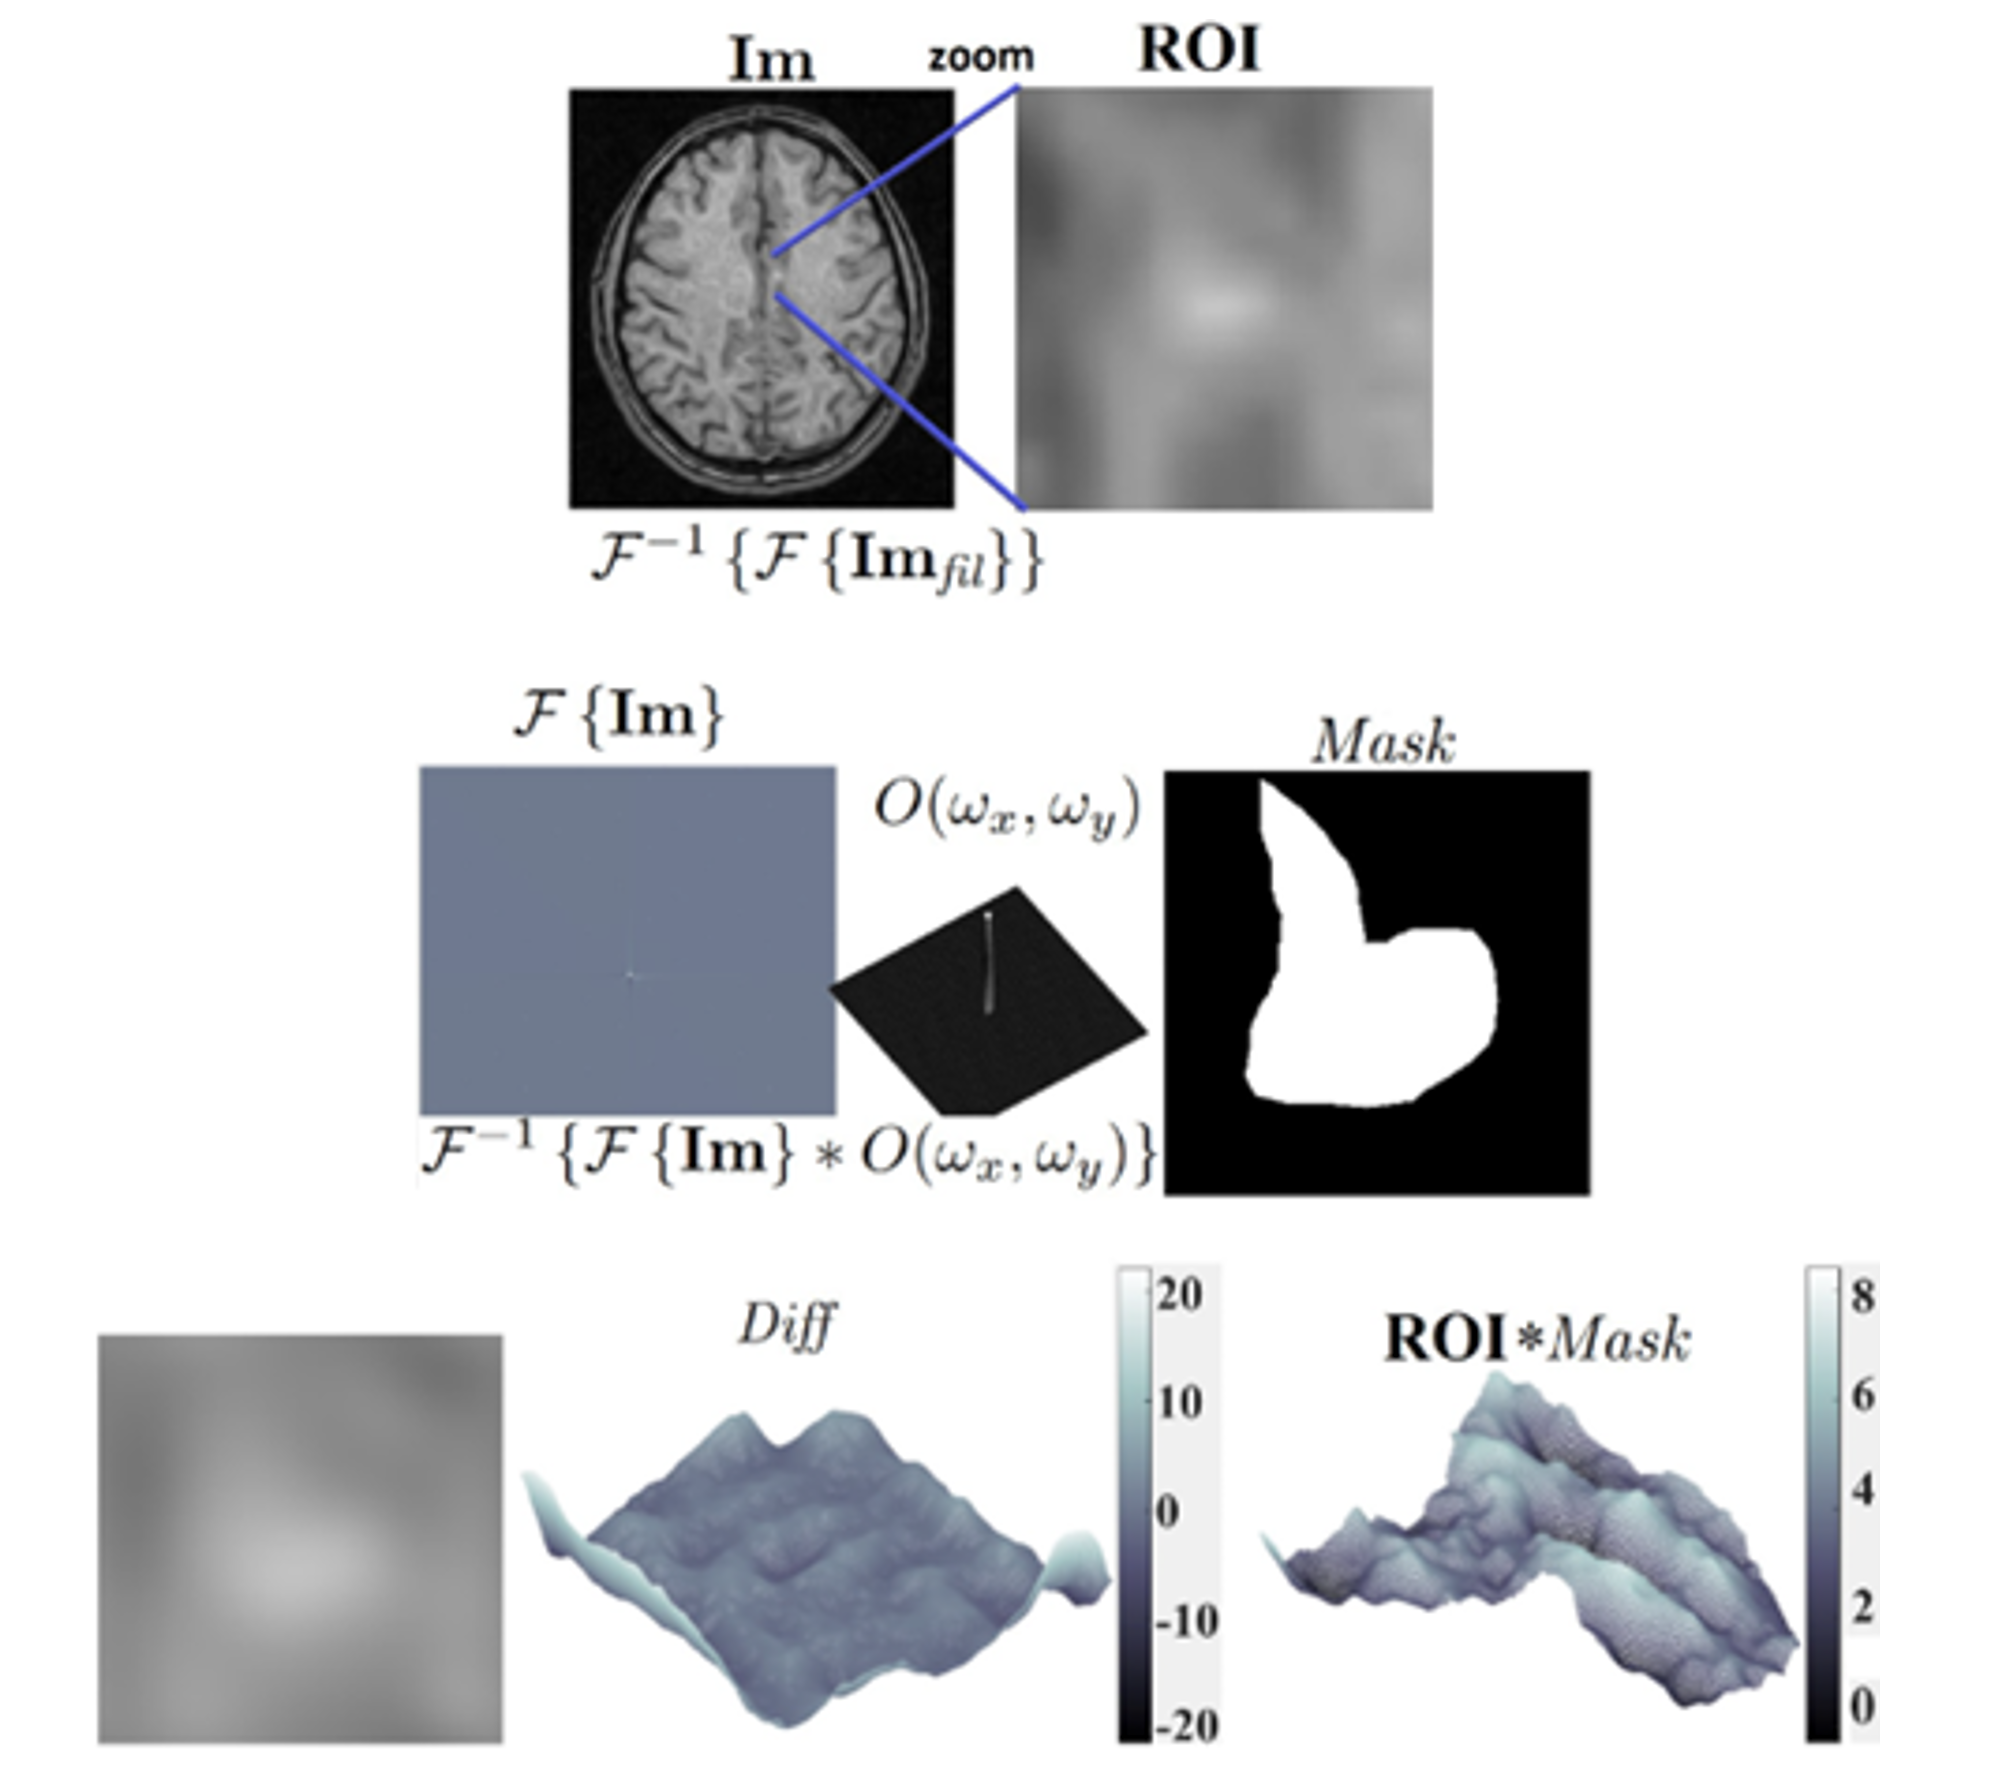
Figure 2. We show the procedure in our proposal, where we start with the image or images under analysis and select an ROI by applying the Fourier transform, removing the periodic pattern by filtering it. We segment the bright zone inside the ROI with a mask and compare it to the filtered image by applying the inverse transform with the original image or metadata
As we previously mentioned, the expected Diff value for a healthy person should be close to zero according to Eq. 4. We performed the operations normalizing the data every time and kept the scale factor until the end. The ROI has 1.5 cm sides, resulting in a bright zone with a maximum length of 7 mm. We compared these values against the values in the gray tones bars on the right side of the surfaces and noticed the bright values are different from zero. Hence, the patient shows an anomaly in the selected ROI. Im is a transversal cut of the brain, and to increase the confidence of our proposal, we also analyze the longitudinal cut of the same ROI, considering the right hemisphere in the tomographic image. The result shows the same behavior, with the value of Diff inside our model displaying a possible anomaly.
We bear in mind that the identified anomaly does not imply a tissue problem such as calcification or tumor [4, 8, 11] or a severe neurological issue since the analysis depends on the brain tissue biochemistry and its interaction with the tomographer electromagnetic radiation [12] which could be altered by emotions and psychologic processes of the patient during the clinical study.
In this work, we show a simple technique to perform a visual analysis of medical images to detect anomalous elements or anomalies in the patient. We are aware that there are several dedicated software tools for diagnostic purposes. However, such tools tend to be very expensive, making our proposal a free tool to support the specialist during the diagnostic procedure.
Our results should be reviewed by several specialists since, despite its simplicity, the MATLAB software is required to execute our code1. Moreover, we are studying a single patient only. Therefore, more tests are required. We consider a minimum of 3 clinical expositions to consider our results as an anomaly and avoid a false positive since the bioelectrical activity can react differently in each individual’s brain tissue. In addition to the manuscript, we provide the code of our proposal as additional material. However, the results should be independent in each analysis, individual, and diagnostic specialist carrying out the clinical evaluation.
ACKNOWLEDGMENTS
The authors want to thank Benemérita Universidad Autónoma de Puebla (BUAP) for the support given during the development of this research work. We also thank Consejo Nacional de Ciencia y Tecnología (CONACYT) for the institutional support.
DISCLOSURES
The authors declare no conflicts of interest.
FOOTNOTE
1 Our code can be found in the GitHub repository
https://github.com/umbramortem/AnomaliesModelling