
Actas del Congreso Nacional de
Tecnología Aplicada a Ciencias
de la Salud

Actas del Congreso Nacional de Tecnología Aplicada a Ciencias de la Salud Vol. 4, 2022
In this work, we slightly modify a mathematical model implementing an isomorphism capable of emulating the projection of surfaces into others, keeping the morphology and topography of the desired surfaces. We apply a modified isomorphism to project a surface with periodic patterns on medical images for the identification of anomalies and recognition of elements, focusing on medical images obtained by HIM (Helium Ion Microscopy) in a study of inoculation of SARS-CoV-2 in rodents. We identify the affected organs and performed several segmentation procedures to delimit the ROIs (Region of Interest) where the virus was identified. After the identification, we apply the isomorphism to obtain a higher resolution, and subsequently, we recover the SARS-CoV-2 phase and morphology.
Keywords: SARS-CoV-2, Isomorphism, ROI Segmented, Helium Ion Microscopy
En este trabajo modificamos ligeramente un modelo matemático que implementa un isomorfismo capaz de emular la proyección de superficies sobre otras, manteniendo la morfología y topografía de las superficies deseadas. Aplicamos dicha modificación al isomorfismo para proyectar los patrones periódicos de una superficie sobre imágenes médicas con la finalidad de identificación de elementos y reconocimiento de anomalías. Nosotros nos centrándonos en imágenes médicas obtenidas por HIM (Helium Ion Microscopy) en un estudio de inoculación de SARS-CoV-2 de roedores. Identificamos los órganos afectados y realizamos varios procedimientos de segmentación para delimitar las ROI (Region of Interest) donde se identificó el virus. Tras la identificación, aplicamos el isomorfismo para obtener una mayor resolución, y posteriormente recuperamos la fase y morfología del SARS-CoV-2.
Palabras Clave: SARS-CoV-2, Isomorfismo, ROI Segmentada, Microscopía de Iones de Helio
Profilometry is a tool that joins several techniques used in the digitization of objects [1] to obtain 3D profiles (three-dimensional) with an acceptable resolution to see non-observable details at first glance. Among these techniques, fringes projection allows us to modify the fringes period to increase the resolution (Takeda or Fourier transform methods). On the other hand, the phase-shifting method enables us to change the period of the structured pattern and scan the study object during the pattern shift covering the whole object allowing the resolution to increase, i.e., the so-called n-steps method. Finally, the stereoscopic vision methods, gather the features of the previous methods and use defocusing and depth elements in the object field. These techniques have several applications in optics, medicine [2], engineering, etc, since they are non-contact techniques that do not contaminate the samples or studies, despite their dependence on microscopy and tomography techniques. We bear in mind that these techniques offer the considerable advantage of avoiding repeating studies (unless the specialist requires it) without contaminating the sample during the computational processing [1]. The three-dimensional digitization started during the 70s with works such as that by Indebetouw [3], and subsequently, with the Moiré control [4] and finally with the Takeda method [5, 6], giving place to Phase-shifting techniques.
Hence, in this work, we focus on several research works where the observation and simple identification is performed with HIM (Helium Ion Microscopy), and such a microscopy tool is applied to study SARS-CoV-2 cells as in the work developed by Frese et al. [7]. We obtain 3D objects from FI (Flat images, 2D images, or frames) obtained by HIM from a cell culture of Vero E6 cells infected with COVID-19, using the algorithms developed by Arriaga et al. [8, 9], including the isomorphism in Arriaga et al. [10]. These techniques are used to identify and analyze the anomalies as sources of cell pathologies from their GT (Gray tones) [2, 8, 10, 11].
In the original work by Frese et al. [7], the Helium Ion Microscopy (HIM) technique its features capable of obtaining direct visualizations (medical images) of cell structures, viruses, and microbian interactions, to obtain images combining sub-nanometric resolution with great field depth and superficial high sensibility. We apply this to an exploratory study of Vero E6 cells infected with SARS-CoV-2, where several images of diverse interaction areas between cells and virus particles were taken, as well as between virus particles, showing a three-dimensional appearance of the SARS-CoV-2 and the surface of the Vero E6 cells with an infection multiplicity around 1, with great morphologic detail. They recall that after a prolonged images formation, a vacuum hydrocarbon deposition was discovered, induced by ions, causing the sample to be properly conductive to allow the images formation, even without charge compensation, which is optimal and innovative in microscopy, providing a tool to optimize the SEM (Scanning Electron Microscope) and TEM (Transmission Electron Microscope) considerably.
On the other hand, the isomorphism built by Arriaga et al. [10] considers FI in GT with flat illumination, perpendicular to the object under analysis, in order to build an algebraic base in terms of the vectors ![]() for pixel 1 and
for pixel 1 and ![]() for pixel 0, obtaining a linear combination (considering the GT [0, 255]) as
for pixel 0, obtaining a linear combination (considering the GT [0, 255]) as 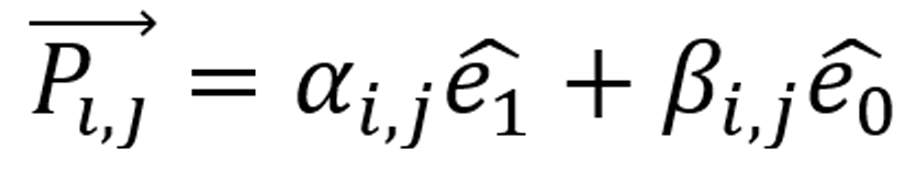 , with αi,j, βi,j scalars in
 ![]() (reals numbers) and i, j denoting the matrix entries, rows, and columns, respectively. The latter results in the vector space VRM, modeling the images in matrices, with each matrix entry a linear combination of the base. Subsequently, we rescale the GT in the set l= { li | i ∈[0,255] ⊂
(reals numbers) and i, j denoting the matrix entries, rows, and columns, respectively. The latter results in the vector space VRM, modeling the images in matrices, with each matrix entry a linear combination of the base. Subsequently, we rescale the GT in the set l= { li | i ∈[0,255] ⊂![]() } to the set g= {gj | j ∈[1,256] ⊂
} to the set g= {gj | j ∈[1,256] ⊂![]() } to associate the white tone with g256 and the black one with g1. Thus, the base generating the FI can be the same base {(
} to associate the white tone with g256 and the black one with g1. Thus, the base generating the FI can be the same base {(![]() ) ̂ ,(
) ̂ ,(![]() )} generating the whole image, with each pixel a linear combination of the base as
)} generating the whole image, with each pixel a linear combination of the base as 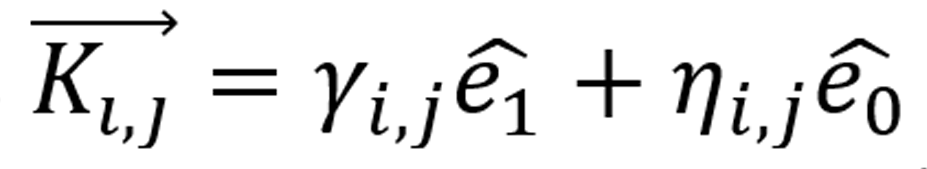 with γi,j, ηi,j scalars in [1,256] for each matrix entry i, j. Hence, we built the base ({
![]() ) ̂ ,(
) ̂ ,(![]() }), which allows us to build vector spaces VRM and VFI in scalars fields A and B (A ⊂ B), respectively.
}), which allows us to build vector spaces VRM and VFI in scalars fields A and B (A ⊂ B), respectively.
Subsequently, Let VRM be the vector space defined as the RM images, VFI the vector space defined by the FIs, and the metric function d. If  holds for two vectors from different pixels and gray tones, then, for the pixels in which g reaches a minimum difference holds
  , simultaneously [10]. Where d(…) is the metric function, which in this case represents the distance between the GT vectors regarding the mentioned base, and T is a linear transformation.
The analysis by HIM is characterized by the acquisition of sub-nanometric images, with remarkable applications in the visualization of viruses and hosts in bacteriologic studies of E. coli infected with Fago T4. We obtain medical images of Vero E6 cells infected with COVID-19 using HIM, focusing on the images in Fig. 1 with a resolution of 1024x1024 for the SARS-CoV-2 culture biologically simulated and infected, both mock-infected and infected at MOI (multiplicity of infection) of approximately 1 (MOI 1). Hence, in Fig. 1 (a), we show cell samples mock-infected with FOV (field of view) of 1.7μm, whereas in Fig. 1 (b), we show MOI-1 cells infected with FOV of 1.7μm. The study region looks brighter, showing the MOI-1 infected cell at FOV 5μm in Fig. 1 (c), and we subsequently move along the cell culture to obtain an image with FOV 2μm in Fig. 1 (d), in both cases without charge compensation. Finally, we obtain images of the culture of MOI-1 infected cells with charge compensation with FOV 3.5μm in Fig. 1 (e), and finally, we show another sample with FOV of 2μm (results from Frese [7]).
Finally, in order to obtain our main results, we focus on regions of interest in the images in Fig. 1 of cell cultures infected with SARS-CoV-2. In Fig. 2 (a)-(b), we perform a simple segmentation procedure with a square region (similar to that in [7]). Subsequently, we apply the i-LP [8] to increase the resolution of the 100x100-pixels image to an image of 700x700 pixels (0.037% error). In Figs. 2 (c)-(d), we show the application of the Gerchberg-Saxton algorithm modified with the 2D-LP with a low-order fit in each iteration (3, 4, 5, and 6 degrees of the 2D Legendre polynomials) [8, 9]. In Figs. 2 (e)-(f), we show normalized images (in normalized GT) of the isomorphism application in Arriaga et al. [10] to obtain the 3D profile (as a 3D Matlab® object), and we append in the upper part a rotation of this object. The heights identified by the isomorphism for the 3D objects are an approximation from the image GT, which depend on the technique (HIM, SEM, or TEM), due to the illumination and scale treated in the image, since from a longitudinal measurement, the GT is interpreted to provide an approximate height value.
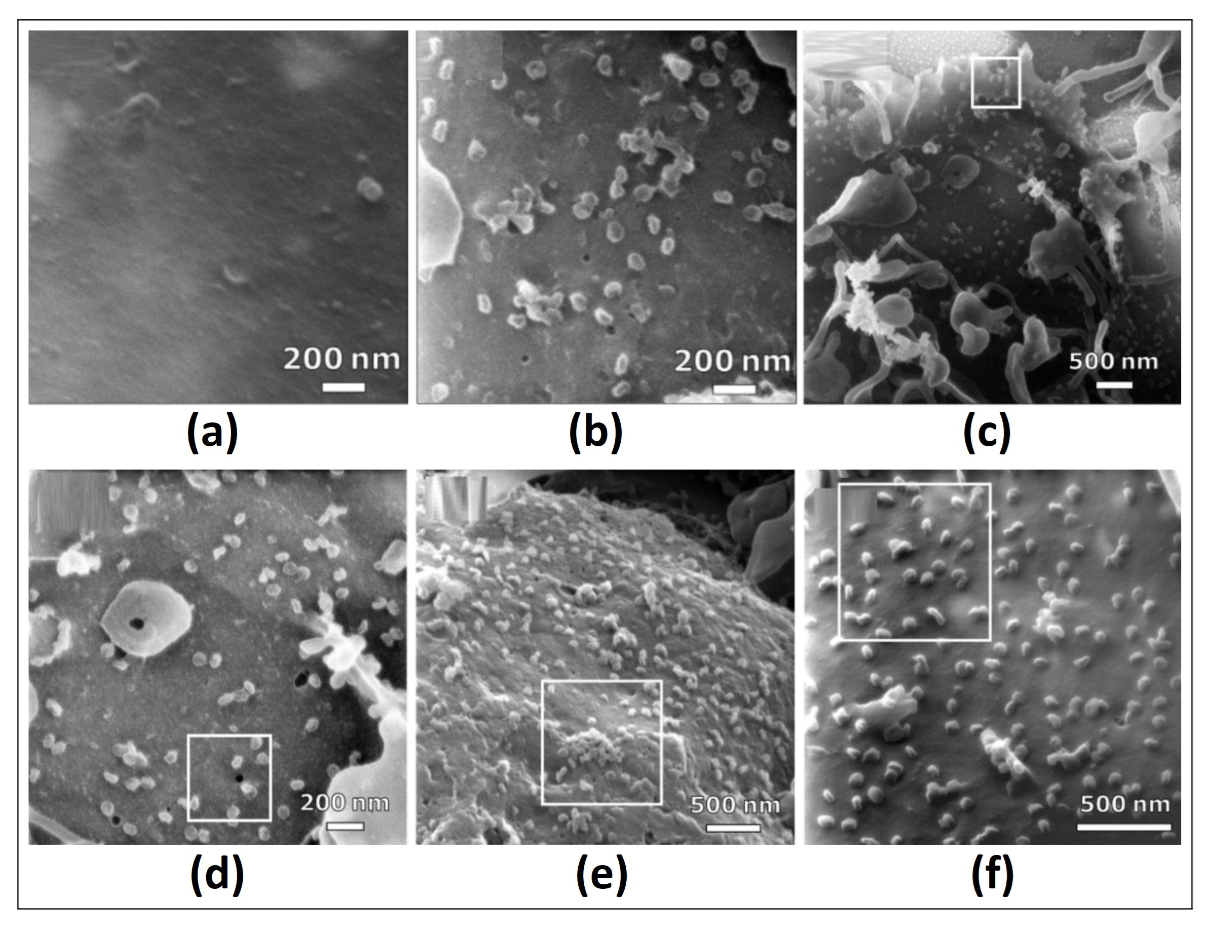
Figure 1. In (a), mock-infected cells with FOV of 1.7μm, in (b) infected MOI-1 cells MOI-1 with FOV of 1.7μm, (c) MOI-1 infected cell with FOV 5μm, (d) cell culture to obtain an image with FOV 2μm; without charge compensation; (e) and (f) images of the cell culture infected in MOI-1 with charge compensation with FOV 3.5μm and 2μm, respectively (results from Frese [7])
Figure 2. In (a) and (b), we show the simple segmentation procedure with a square region, with an increased resolution up to 700x700, applying the i-LP in Arriaga et al. [8], (c) and (d), we show the application of the Gerchberg-Saxton algorithm modified with the 2D-LP [8, 9], and in Figs. 2 (e) and (f), we show normalized images (in GT and magnitude to 1) of the 3D objects applying the isomorphism in Arriaga et al. [10]
The studies or analyses performed by HIM, biological, clinical and chemical, etc., are characterized by the obtained sub-nanometric images, intending to preserve the sample. In this case, we successfully used such techniques to observe the SARS-CoV-2 virus, its interaction in the host tissue and with other cells, as well as its influence on the host at a sub-nanometric scale. We obtain the SARS-CoV-2 cells ROIs and increase the resolution successfully to 1024x1024-size matrices, noticing the interaction of the virus-cell with healthy ones as well as how the cells as an ensemble damage several tissues [Figs. 1 (e) and 2 (c)]. Finally, in Fig. 2, we validate the segmentation procedure, filtering, and resolution increase, along with the 3D profile recovery of the virus SARS-CoV-2 cell, emphasizing that the phase of our isomorphism proposal is capable to obtain the phase of the radiated or illuminated zones by the HIM, and the information from cells without illumination will not be determined [10].
acknowledgments
The authors want to thank Benemérita Universidad Autónoma de Puebla (BUAP) for the support given during this research work. We also thank CONACYT (Consejo Nacional de Ciencia y Tecnología, México).
Disclosures
The authors declare no conflict of interest.